
Guides
How to Read Your Cash Flow Overview and Money Flow Breakdown
A tour of BankFlow's Cash Flow page: the financial verdict, the data coverage score, upcoming 30 days, and the money-flow view that traces income to savings and expenses.
Last verified in BankFlow on August 20, 2026.
Last verified in BankFlow on August 20, 2026.
Where to Find It
Open Plan in the sidebar to reach the Cash Flow page. It has four tabs: Overview, Forecast, Breakdown, and Review. This guide covers Overview and Breakdown, the two read-first tabs that summarize where you stand and where money moves; Forecast (scenario planning) and Review (flagged transactions) get their own guide.
The Headline Metrics
Balance today is your current available balance. Monthly surplus is income minus spending. Savings rate compares against a 20%+ target, and Emergency runway compares your reserves against a 3-month target, showing "Healthy" once you clear 6 months.
Your Financial Verdict
The Get advice button is a manual, on-demand action, not something that runs automatically on every visit. Tap it and BankFlow generates a plain-language verdict plus a short, prioritized list of moves, using an AI call that's cached until you choose to regenerate it, so it survives a page reload without re-running.
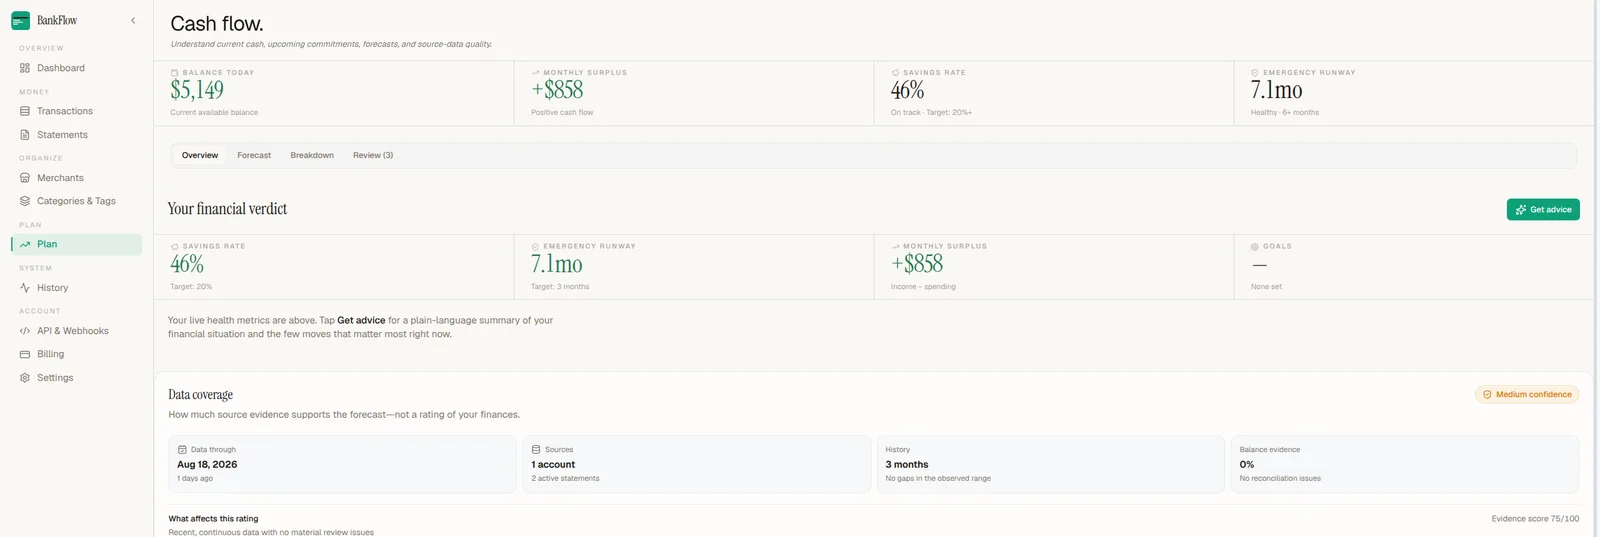
Below the verdict, Data coverage tells you how much to trust the numbers above it, not how healthy your finances are. It breaks down how recent your data is, how many accounts and months of history back it, and whether balances reconcile cleanly, rolling up into an evidence score and a confidence label like "Medium confidence."
Breakdown: Where Your Money Actually Goes
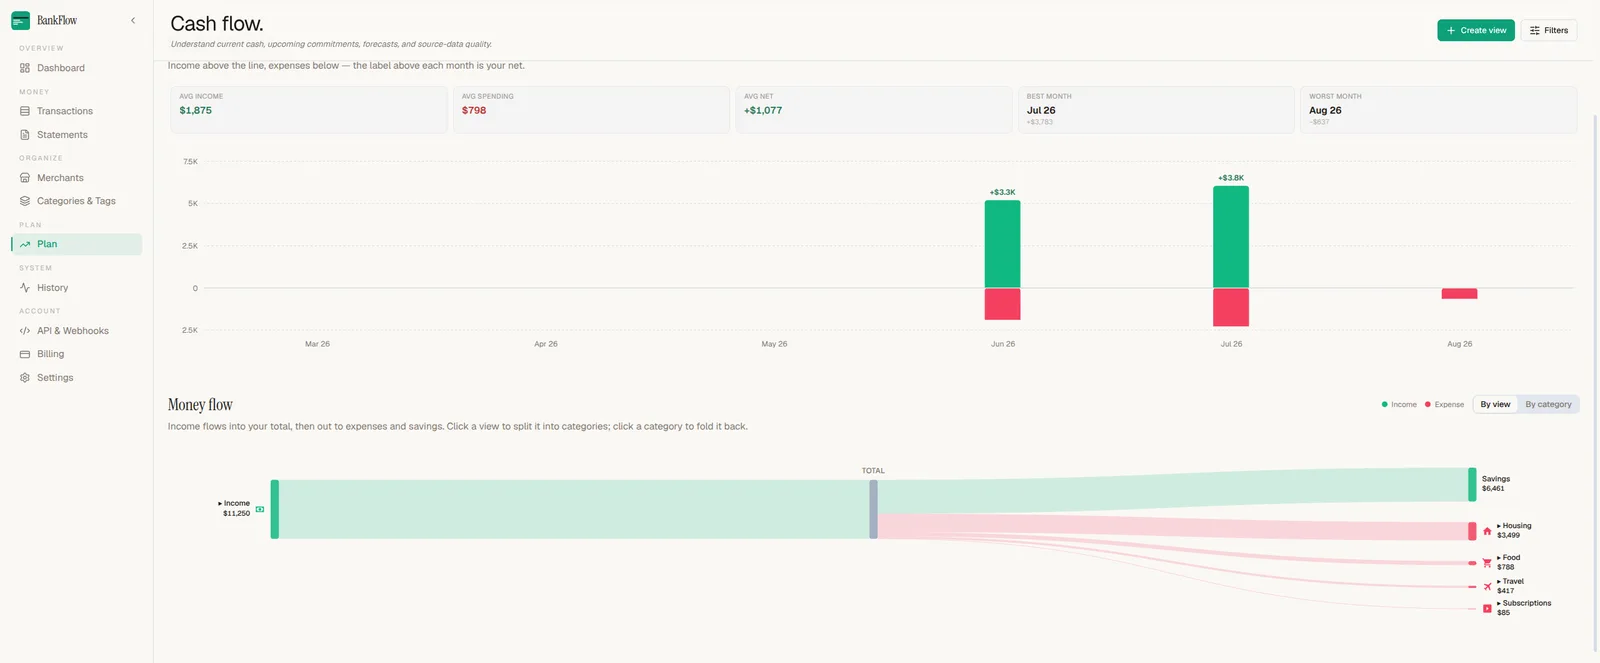
Switch to the Breakdown tab for average income, average spending, average net, and your best and worst months, plotted as a bar chart. Below that, Money flow is a Sankey diagram tracing income into savings and expense categories, click a view or category to expand it into its components, and click again to fold it back.
What's Not Covered Here
The Overview tab also surfaces Upcoming 30 days (expected cash in versus committed cash out, detected from recurring patterns in your statements) and an Estimated safe to spend figure next to it. The Forecast tab (scenario controls) and Review tab (flagged transfers and exceptions) go deeper than this guide covers; we'll walk through both separately.
Next Step
For the numbers this page is built from, see how to read your BankFlow dashboard.